Direction matters most
PVGIS, the European Commission's solar model, uses satellite records from 2005-2023 to estimate what a system makes in a typical year, after standard losses of 14% (PVGIS 5.3). For central Wigan at a 35° pitch, the way the roof faces changes the answer far more than anything else:
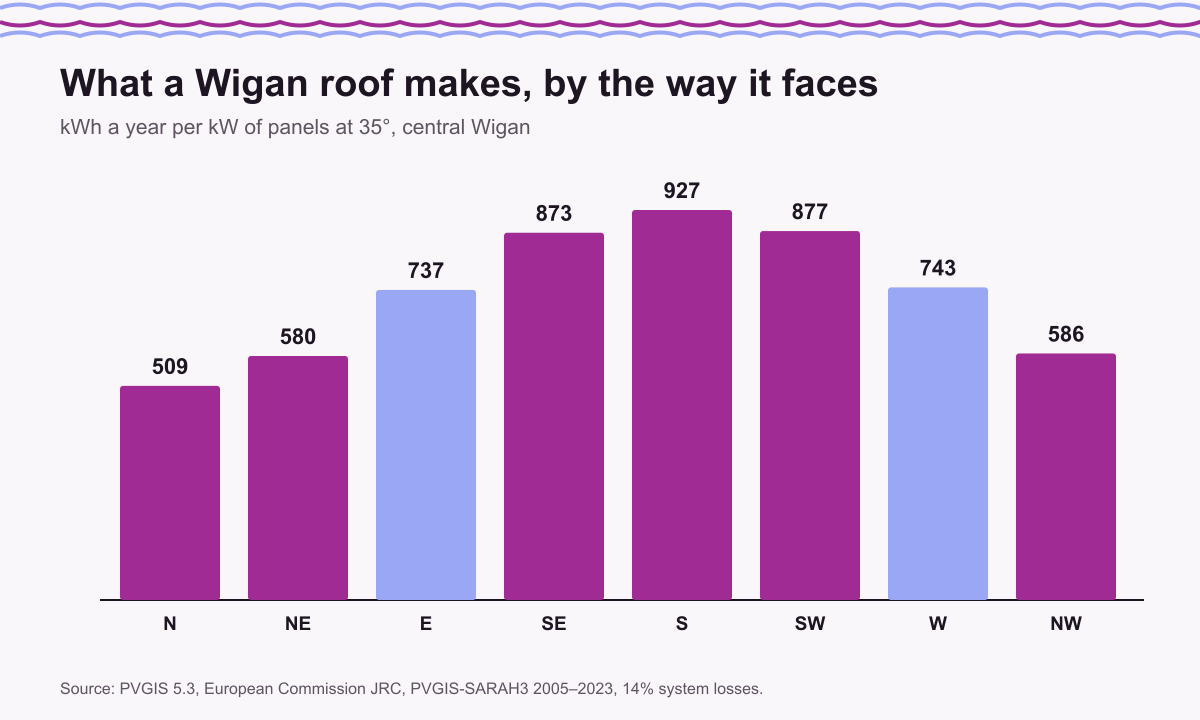
South gives 927 kWh per kW a year; south-east and south-west are within a few per cent, at 873 and 877. East and west sit almost level at 737 and 743, roughly four-fifths of south. Even a north-facing slope makes 509, though at that level most installers would suggest another slope first.
Twelve places across the borough
PVGIS works in small satellite cells, so we ran twelve places: the towns, and points between them. The table gives kWh per kW a year at 35° for the four directions most Wigan roofs face.
| Place | South | East | West | Flat |
|---|---|---|---|---|
| Atherton | 911 | 730 | 730 | 766 |
| Tyldesley | 911 | 730 | 731 | 766 |
| Shevington | 918 | 732 | 739 | 772 |
| Standish | 919 | 731 | 739 | 772 |
| Hindley | 923 | 736 | 740 | 774 |
| Leigh | 926 | 740 | 740 | 777 |
| Wigan centre | 927 | 737 | 743 | 777 |
| Ince | 927 | 737 | 743 | 777 |
| Golborne | 930 | 741 | 742 | 779 |
| Pemberton | 932 | 739 | 746 | 780 |
| Ashton-in-Makerfield | 932 | 741 | 744 | 779 |
| Orrell | 936 | 740 | 751 | 783 |
The spread is small: about 3% between Atherton and Orrell for a south roof. In practice that means a quote's yearly estimate should not differ much between, say, Hindley and Orrell for the same roof. If two installers give very different figures for your house, the reason is in their assumptions about your roof, not your address.
Through the year
Output is heavily seasonal. At the best angle in central Wigan, each kW makes about 31 kWh in January, 113 in June and 28 in December, and about 69% of the year's total arrives between April and September, by our arithmetic from PVGIS.
| Jan | Feb | Mar | Apr | May | Jun | Jul | Aug | Sep | Oct | Nov | Dec |
|---|---|---|---|---|---|---|---|---|---|---|---|
| 31 | 50 | 82 | 109 | 119 | 113 | 113 | 102 | 85 | 59 | 40 | 28 |
That seasonality is why an installer's monthly figures, if they give them, should rise steeply into summer. It is also why a battery charged by the panels is fullest in the long days and nearly idle in December: see batteries in Wigan homes.
Angle and flat roofs
The best fixed angle in central Wigan is about 40° facing south, giving 929 kWh per kW, only a little more than the 927 at 35°. Between 30° and 45° a south roof barely changes, so on a typical pitched roof there is no need for frames to chase the perfect angle. Panels laid flat make about 777; on a flat roof they are usually tilted on frames, within the planning limits (planning rules).
Three Wigan roofs, worked through
To show how the figures become a yardstick for a real quote, here are four common cases, each using PVGIS for the nearest of our twelve places (our arithmetic from PVGIS 5.3):
- A semi in Hindley, back slope facing south, 4 kW: about 3,692 kWh a year.
- A semi in Atherton facing east and west, 2 kW on each slope: about 2,920 kWh a year, spread more evenly through the day.
- A terrace in central Wigan with a south-west rear slope, 2.5 kW: about 2,193 kWh a year.
- Panels laid flat on a garage roof in Golborne, 2 kW: about 1,558 kWh a year, before any tilt frames.
PVGIS assumes an open site. A neighbour's extension, a tall tree or the chimney stack on a party wall all cut into these figures, and only a survey sees them: on a semi the usual suspects are the hip end and the next-door stack, on a terrace the back extension below the rear slope. An installer's estimate a little below the figures above is normal for that reason; one well above them needs explaining. The east-west semi makes less in a year than the south-facing one but spreads it across the morning and evening, which changes the case for a battery (see batteries). For the price side of the same roofs, the costs page gives the regional means, and semis and terraces covers what each house type's roof allows.
Using the figures on a quote
Multiply the system size in kW by the figure for your direction and place, and you have a fair yardstick for the installer's yearly estimate. RECC says its members follow strict rules for calculating performance estimates (RECC), and those rules can include allowances for shade that PVGIS does not see, so an estimate a little lower than PVGIS is normal. One noticeably higher deserves a question. The quote checker does the sum for you, and the costs page covers the price side.
Solar is already common across these places: government figures count 6,529 solar PV installations of every size in the borough at the end of 2025 (DESNZ), so a neighbour with panels on a similar roof can be a useful second check.